The Impact of Trade and Distribution on CPG Success

For the Consumer Packaged Goods (CPG) industry, a lot of focus in marketing analytics is placed on things like marketing mix modeling, consumer behavior, and brand strategy. But there’s another crucial piece that often doesn’t get as much attention: the role of trade and distribution in driving business outcomes. These aren’t just logistical details—they’re powerful factors that can significantly influence a brand’s performance in the market. 

As someone who works closely with CPG companies, I’ve seen how important trade and distribution strategies are to a brand’s success. Activities like in-store promotions, price discounts, and product placement deals directly impact what consumers buy. Similarly, the distribution model a company uses can either enhance or limit its ability to get products on shelves and into customers’ hands. These factors are often the unsung heroes behind a brand’s market share and overall profitability. 

The Importance of Distribution Models 

One distribution approach worth highlighting is Direct Store Delivery (DSD). For those who aren’t familiar, DSD involves delivering products directly to retail stores instead of going through distribution centers. This allows companies to have more control over how their products are displayed and stocked, which can lead to fresher products on the shelves and a quicker response to what the market wants. 

However, DSD isn’t without its challenges. Running a DSD operation is more complex and demanding than traditional distribution methods. It requires close attention to everything from delivery schedules to shelf space and product availability. But for companies that can manage these challenges, the benefits are clear. The extra control that DSD provides can lead to better sales and a stronger presence in stores. 

Modeling Trade and Distribution in Marketing Analytics 

Given how important trade and distribution are to the success of CPG brands, it’s critical that these factors are accurately reflected in marketing mix models (MMM). Unfortunately, many MMM practices focus more on media and advertising, often leaving trade and distribution underexplored. This is a missed opportunity, especially for companies using complex distribution methods like DSD. 

To truly understand the impact of trade and distribution on business outcomes, it’s important to use a modeling approach that matches the level of detail involved in these areas. This is where Hierarchical Bayesian models come in. These models are particularly good at handling the complexity and detail required to accurately represent trade and distribution activities in MMM. 

Hierarchical Bayesian models allow us to combine different levels of data—like store-level sales, regional distribution patterns, and national trade activities—into one cohesive framework. This level of detail ensures that the model captures the true drivers of business performance, providing more accurate and actionable insights. For CPG companies using a DSD model, this level of detail is not just helpful—it’s essential. 

The Takeaway for CPG Brands 

For CPG brands, especially those using complex distribution methods like DSD, it’s important that your marketing analytics efforts don’t overlook the impact of trade and distribution. While media and advertising are important, they’re just one part of the story. To really understand and improve your brand’s performance, your MMM should reflect all the factors that drive your business, including trade and distribution. 

By using advanced modeling techniques like Hierarchical Bayesian models, you can make sure that your analytics are as detailed and accurate as your business operations. This won’t just lead to better insights—it will help you make decisions that drive real growth. 

Trade and distribution deserve more attention in marketing analytics. These elements are crucial to the success of CPG brands, and their impact should be fully accounted for in any comprehensive marketing mix model. As the CPG landscape continues to change, those who can navigate the complexities of trade and distribution will be the ones who succeed. 

MTA is Dead! Long Live MTAi: The Future of Multi-touch Attribution

For years, Multi-touch Attribution (MTA) has been the cornerstone of marketing measurement. It promised precise insights into the customer journey, enabling marketers to optimize campaigns, allocate budgets, and drive ROI. But as we face new privacy regulations, changing consumer behaviors, and a highly fragmented media landscape, it’s clear that traditional MTA is no longer up to the task.

It’s time to evolve. Enter MTAi (Multi-touch Attribution Intelligence) a revolutionary approach that addresses MTA’s flaws and redefines how marketers understand their impact across channels.

The Problems with Traditional MTA

Despite its early promise, traditional MTA has struggled to keep pace with today’s marketing complexity. Here are the critical challenges:

  1. Data Gaps: With the rise of privacy regulations like GDPR and the phasing out of third-party cookies, MTA’s reliance on user-level tracking has become unsustainable. Data is increasingly inaccessible, undermining the accuracy of its models.
  2. Over-Simplification: Customer journeys are more dynamic than ever, but traditional MTA frameworks often rely on static, linear models that fail to reflect the real-world complexity of consumer behavior.
  3. Black Box Algorithms: Many MTA tools lack transparency, leaving marketing teams to rely on results they can’t fully understand or explain.
  4. Channel Bias: Traditional MTA struggles to incorporate offline channels and emerging formats like influencer marketing, creating blind spots in measurement.

Introducing MTAi: The Next Generation of Attribution

At i4i, we’ve developed MTAi, a groundbreaking solution that overcomes the limitations of traditional MTA while leveraging the power of AI and machine learning. Designed for modern marketing challenges, MTAi offers a holistic, future-proof approach to attribution.

Why MTAi Works:

  • Privacy-First Modeling: By utilizing synthetic and aggregated data, MTAi provides actionable insights while maintaining compliance with privacy regulations.
  • AI-Driven Insights: The platform continuously learns and adapts, capturing the non-linear, multi-device, and multi-channel journeys of today’s consumers.
  • Unified Measurement: MTAi seamlessly integrates online and offline data, providing a comprehensive view of all touchpoints in the customer journey.
  • Actionable Transparency: Marketers can clearly understand and explain how value is attributed, empowering them to make data-driven decisions with confidence.

How MTAi Works

MTAi leverages advanced AI techniques, including large language models (LLMs) and machine learning algorithms, to analyze the sequence, timing, and context of touchpoints. This approach is akin to predictive text generation, where patterns are identified over time to deliver accurate, actionable insights.

For example, MTAi doesn’t just track that a customer engaged with an email and then visited a website. It evaluates the timing and order of these events to predict their impact on conversion, offering a far more nuanced view of customer behavior than legacy methods.

Proven Results: Case Studies

MTAi has already delivered measurable results for forward-thinking organizations:

  • Hospitality Loyalty Program: Analyzed data from 93,000 loyalty members, 557,000 visits, and 103,000 bookings, achieving a 45% improvement in predictive accuracy versus traditional models.
  • Criteo Kaggle Dataset: Outperformed complex LSTM models by 28% in predicting conversions and touchpoint occurrences.

These successes highlight MTAi’s ability to drive better outcomes by addressing the nuances of real-world customer journeys.

Key Advantages Over Traditional MTA

MTAi doesn’t just replace MTA; it reinvents it. Designed for the challenges of today and the uncertainties of tomorrow, MTAi’s roadmap includes enhanced modeling for offline media and capabilities to predict missing touchpoints, making it a true full-funnel solution.

  1. Sequence and Timing Analysis: MTAi accounts for the order and timing of touchpoints, enabling a more accurate understanding of customer behavior.
  2. Real-Time Insights: Marketers can dynamically adjust campaigns based on up-to-the-minute data, improving agility and responsiveness.
  3. Smarter Budget Allocation: By identifying the most impactful touchpoints, MTAi ensures marketing spend delivers optimal ROI.
  4. Explainable AI: Unlike traditional black-box models, MTAi provides transparency into its attribution decisions, helping teams build trust in their data.

Traditional MTA has reached its limits. It’s time to embrace the future with MTAi, a solution built to thrive in a world of increasing complexity and regulation.

Are you ready to revolutionize your marketing measurement? Let’s start the conversation. Book a meeting with the i4i team.

Understanding Target’s Strategic Price Reductions Through Budget-Constrained Choice-Based Conjoint Analysis

Recent news has highlighted that Target is anticipating lower sales during the 2024 holiday season and has already begun reducing the prices of many products. This strategic move comes in response to a challenging economic environment where consumer spending is increasingly constrained by inflation and post-pandemic financial adjustments. At in4mation insights, we believe that understanding the rationale behind such pricing strategies can be significantly enhanced through the lens of Budget-Constrained Choice-Based Conjoint Analysis (BC-CBCA). 

Consumers are More Budget-Conscious Than Ever 

With rising living costs, shoppers are prioritizing essential purchases and looking for the best value for their money. Traditional Choice-Based Conjoint Analysis (CBCA), while powerful, often overlooks the critical aspect of consumer budget constraints. This is where BC-CBCA steps in, offering a more nuanced understanding of consumer behavior under financial limitations. 

Why Budget-Constrained Choice-Based Conjoint Analysis? 

Traditional CBCA assumes that consumers evaluate all available options without considering their budget limitations. However, BC-CBCA integrates budget constraints directly into the choice modeling process. Here’s how it works: 

  1. Realistic Predictions: By accounting for budget constraints, BC-CBCA provides more accurate predictions of consumer choices. For example, a product priced beyond a consumer’s budget is effectively ignored, regardless of its attributes. 
  2. Segment Identification: BC-CBCA helps identify consumer segments with similar budgetary limits. This allows brands to tailor their product designs and pricing strategies to meet the needs of different consumer groups more effectively. 
  3. Enhanced Insights: Understanding how budget constraints influence purchasing decisions enables companies to optimize their pricing strategies. This is particularly relevant for retailers like Target, which are navigating a landscape where price sensitivity is heightened. 

Target’s Strategy Through the BC-CBCA Lens 

Target’s decision to lower prices is a strategic response to attract budget-conscious consumers during the holiday season. Here’s how BC-CBCA can shed light on this approach: 

  1. Price Sensitivity Under Budget Constraints: As prices are reduced, the probability of a product falling within a consumer’s budget increases, thereby boosting its attractiveness and potential sales. BC-CBCA can model this behavior more accurately than traditional methods. 
  2. Optimizing Product Mix: By understanding the budget constraints of their target market, Target can adjust its product mix to emphasize items that are more likely to be purchased within these financial limits, enhancing overall sales performance. 
  3. Marketing and Promotions: Insights from BC-CBCA can guide Target in crafting targeted marketing campaigns that resonate with budget-conscious shoppers, highlighting value and affordability. 

Target’s proactive pricing adjustments underscore the importance of understanding consumer behavior in a budget-constrained environment. At in4mation insights, our expertise in BC-CBCA equips us to provide unparalleled insights into how budget constraints influence purchasing decisions, enabling brands to optimize their pricing strategies effectively. 

If you’re interested in exploring how BC-CBCA can enhance your pricing strategies and drive sales growth, reach out to us at info@in4ins.com. 

Understanding Choice in CPG

In consumer packaged goods (CPG), understanding consumer choice involves unique challenges. CPG researchers often use scanner and panel data, with existing share estimates that make even minor share shifts significant. Some key issues in CPG research are below.

  1. Measuring Volume
    In CPG, understanding both the choice of product and the quantity purchased is crucial. However, standard methods for including quantity in choice models often fall short.
  2. Large Numbers of Stock Keeping Units (SKUs)
    CPG categories can involve a large number of SKUs, sometimes up to 500 for the top 80% of volume. Strategies for modeling choices need to consider such complexity.
  3. Multiple Sizes and Pack Counts
    CPG products come in a variety of sizes and counts, driven by marketing strategies. This variety affects patterns of competition and cannibalization, as well as price sensitivity measurement.
  4. Purchase Versus Usage
    Choice tasks often measure purchase decisions, but what often matters more is the usage occasion. Different family members may use products in different contexts, which complicates modeling.
  5. Choice of Where to Buy
    The decision of what to buy can depend on where it is purchased—whether it’s an outlet, an aisle, or online. CPG products are often available both in-store and online, adding another layer of complexity to modeling choices.
  6. Multiple Categories
    CPG products are usually bought alongside others, unlike one-off purchases like cars. This raises the question of whether choices in one category are related to choices in another.
  7. Pricing
    One of the main goals of choice modeling in CPG is understanding price sensitivity. However, affordability also plays a role, and standard models ignore this aspect, focusing only on sensitivity.
  8. Calibration
    While calibration is sometimes viewed negatively, it has practical uses in making model outputs match real-world data. Proper calibration can improve the accuracy of CPG choice models. Should you calibrate shares, price sensitivity, both, others, or nothing?
  9. Volume Measurement
    Firms use metrics like unit volume or equivalized volume (e.g., hectoliters, pounds) to track market share, which is often volume- or dollar-based. In contrast, choice models tend to calculate share based on the incidence of purchase of a small set of items, leading to discrepancies. Volume related issues are sometimes addressed in post-analysis by aggregating shares or probabilities and multiplying by a category volume number.


SUMMARY

A simpler approach works well for one-time, single-unit, same size purchases, but CPG products are purchased repeatedly, in different sizes and counts, and for different occasions. Therefore, CPG choice modeling involves not only the selection of a brand but also the choice of package size, count, price, and affordability, which are interdependent and affect consumer decisions.

Countdown to Black Friday: Retail Media Strategies for Holiday 2024

Retail media has proven to be particularly effective during seasonal periods. Retailers live and die by seasons, which create natural peaks and valleys in consumer demand. From New Year’s resolutions and Valentine’s Day to Easter, summer sales, and a myriad of retailer-specific holidays like Prime Day and Back-to-School, these events offer an excellent tempo for organizing retail media campaigns.  

With fewer days between Thanksgiving and Christmas this year, understanding and leveraging these opportunities can significantly enhance the effectiveness of your retail media strategy. 

Understanding Seasonal Baselines 

One of the key insights for maximizing retail media success is recognizing the importance of seasonal baselines. These periods often come up quickly and create sharp spikes in consumer activity. Therefore, having a clear understanding of historical data and trends is crucial. This data helps in setting realistic expectations and in measuring the incremental impact of your campaigns. 

During these peaks,  methods of test and control may not be feasible. Retailers and advertisers are often unwilling to engage in controlled experiments during their busiest times. Instead, you should focus on gathering as much data as possible from previous years, and use your MMM model, to establish a robust baseline against which you can measure your results. 

Leaning into the Spike 

Retail media strategies need to lean into these seasonal spikes at least two to three weeks ahead of the event. For online sales, this means starting your campaigns earlier, as online consumer behavior tends to ramp up gradually before peaking. In contrast, in-store sales often exhibit a much sharper increase during the actual event period. 

By planning your campaigns to align with these behaviors, you can ensure that your messages are reaching consumers at the right time. This early engagement can help build awareness and anticipation, leading to higher conversions when the peak period hits. 

Flexible Budgeting and Keyword Strategy 

As seasonal events approach, the competition within retail media networks becomes fierce. Events like Black Friday, Cyber Monday, and other major sales can lead to inflated media costs. To navigate this, a flexible approach to budgeting is essential. Shift your focus to higher-margin, longer-tail keywords that may be underpriced compared to the highly competitive terms. This strategy allows you to maintain visibility without overspending on the most contested keywords. 

Additionally, consider diversifying your spend across less saturated retail media networks. For example, delivery apps and hospitality brands may offer lower competition and better value during these peak periods. This approach can help protect your digital shelf and ensure your products remain visible even when competition is at its highest. 

Leveraging Multi-Brand Platforms and Influencers 

During peak seasons, the saturation of ads can lead to banner blindness, where consumers become desensitized to the overwhelming number of ads. To combat this, consider leveraging multi-brand platforms or ads. These collaborative efforts, reminiscent of old retail tactics like tri-brewer ads in the beer business, allow multiple brands to share the spotlight in a single advertisement. This not only reduces costs but also increases the ad’s appeal by offering consumers more choices in one place. 

Influencer partnerships are another effective strategy during these periods. Influencers can cut through the noise and deliver your message in a more personal and engaging manner. Their followers trust their recommendations, which can lead to higher engagement and conversions during these critical times. 

Conclusion 

Seasonal strategies for retail media require a combination of historical data analysis, early engagement, flexible budgeting, and innovative advertising approaches. By understanding the nuances of seasonal consumer behavior and leveraging the right mix of tactics, you can maximize the impact of your retail media campaigns. Remember, the goal is to anticipate the spikes, prepare accordingly, and execute with precision to ensure your brand stands out during these high-stakes periods. 


This article was based on a recent webinar, “Navigate Retail Media for Maximum ROI: How Marketers Can Ensure Profitability and Incrementality with RMNs,” hosted by i4i’s Mark Garratt with featured guest, Nikhil Lai of Forrester. 

 For more insights on navigating RMNs, check out our guide here.   

Understanding Media Attribution to Sales

A common question I often get about media attribution is, “How do you attribute media to sales?” This query always excites my inner data nerd! My typical enthusiastic response is, “We fit a hierarchical Bayesian model that relates adstock saturation transformed media to sales,” which usually leaves everyone more confused.

So, what does that mean in plain English?

Let’s break it down.

Hierarchical means we are stacking similar data together, such as by region, and sharing insights across these groups. This allows us to draw more robust conclusions by leveraging similarities and differences across the data.

Bayesian refers to the statistical approach we use, which not only helps us learn the effect of media on sales but also measures our confidence in these effects. It provides a probabilistic framework, giving us a richer understanding of the data and its uncertainties.

Adstock captures the time-delay effect of media. Most advertising has a delayed impact on sales, and adstock helps us account for this lag.

Saturation accounts for diminishing returns. After a certain point, additional media spend has less and less of an impact. The saturation function helps us adjust for this nonlinear effect.

So, in simpler terms, a better explanation might be “We adjust media for delayed impact and diminishing returns, then relate adjusted media to sales using a model that shares learning and estimates uncertainty.”

By adjusting for these factors, our models provide a more accurate and nuanced understanding of how advertising translates into sales. This approach not only helps in pinpointing the effectiveness of different media channels but also enhances our strategic planning by understanding the varying impacts across regions.

Understanding these concepts can significantly elevate your media attribution strategy, providing actionable insights and driving more informed decision-making in your marketing efforts.

We’ve built the industry’s most innovative marketing optimization and scenario planning software:  Optimetry® that puts your internal media experts in the driver’s seat, for dynamic “what if” scenario planning and spend adjustments over the life of your campaigns.  Learn more: https://in4ins.com/optimetry/


Better Business Results through Robust Marketing Measurement and Optimization

Marketing’s primary objective is to drive profitable business outcomes. While specific goals may vary across companies, the overarching aim typically involves achieving sales targets, increasing market share, cultivating brand health, and enhancing shareholder value. Doing so entails strategically positioning products or services in the market, effectively communicating their value proposition, and engaging customers in ways that prompt desired actions and results. Tactics such as advertising, promotions, market research, advanced analytics, and customer relationship management can deliver measurable contributions to your company’s success.

The corresponding principle is that every marketing investment must achieve maximum, quantifiable return on investment (ROI). This is evident in measuring the effectiveness of media spending, your agility to adjust pricing to market changes, the strategic design of promotions to influence consumer actions, the careful selection of product attributes to attract buyers, and the specific selection of target buyer segments to the exclusion of others.

While the aspiration for “better business results” may seem straightforward, the path to achieving it—ensuring that all marketing investments contribute most effectively—is exceedingly complex. Yet none of your marketing investments operate independently; they are interconnected.

Your company must adapt swiftly to dynamic market changes and discern which business drivers will have the greatest impact on your goals and KPIs.

Therefore, the initial question you want your marketing analytics and research partner to answer is: “Where can your optimized your marketing dollars take you in the pursuit of optimal business growth?”

At in4mation insights, we are committed to harnessing robust analytics and deliver hands-on decision support. Our aim is to provide proven strategies that drive growth.

How can we help to drive optimal decision making? 

None of your marketing endeavors exist in isolation. Each demands particular expertise to refine and adjust strategy throughout your campaigns.

Consider the media and marketing mix. Numerous factors influence Return on Advertising Spend (ROAS), including:

    • the varying effectiveness and contributions of different media channels,
    • geographical considerations for brands with uneven and imbalanced penetration across markets,
    • seasonal product trends and weather patterns, changing market dynamics and
    • for Consumer Packaged Goods (CPG) companies, the complex and enigmatic metrics associated with the proliferation of retail media networks.

There’s growing consensus that robust analytical approaches, like Marketing Mix Modeling (MMM), have resurfaced as the most reliable resource for evaluating and optimizing media dollars and spending on other marketing tactics within your overall marketing budget. With the complexity of today’s marketing challenges, it’s critical to partner with advanced MMM firms who have robust and effective software and analytical tools that deliver swift, accurate, and detailed optimization results at every level of granularity that matches your needs.

Yet, media and promotional spending do not function in isolation. They are distinct components within the broader, often intricate, marketing frameworks that integrate disparate elements and datasets. When meticulously synchronized to complement each other, these components offer the most effective means to persuade consumers to select your brand, product, or service.

Pricing serves as a foundation of your firm’s offerings, yet to attain optimal sales volume, your teams require detailed data to portray price sensitivity, identify gaps, and uncover the drivers of premiumization. Adjusting pricing based on evidence from consumer choice models, AKA Choice-based Conjoint Analysis (CBCA) — a tried-and-true methodology — can yield maximum benefits.

    • CBCA allows you to simulate real-world decision making, as buyers “purchase” from a set of market solutions or offers which have different features, functions, and prices.
    • CBCA can handle a large number of product or service attributes, making it suitable when the marketplace has items with diverse features and options.
    • CBCA estimates the relative importance of different attributes by quantifying their impact in driving choice.
    • CBCA uncovers the trade-offs that buyers will make between different attributes. This knowledge is crucial for optimizing your product and pricing strategies.

Your strongest defense in navigating a complex and ever-changing market landscape is to align with an analytics solution provider—which Forrester calls a “MMO” or Marketing Measurement and Optimization service provider—whose expertise in data science spans across all the above challenges.

Whether you’ve grown your internal analytics function or seek external expertise to address the multifaceted factors influencing consumer choices and decision-making, an MMO partner can assist brands in forecasting, optimizing, and taking decisive actions which yield more effective marketing investment strategies.

While there’s no one-size-fits-all approach in marketing performance analytics, generic or do-it-yourself solutions fail to deliver the necessary business impact in these intricate times.

    • Seek out partners with extensive experience in robust analytics, tailored to address your specific challenges.
    • Look for those capable of providing customized services and offering marketing and upskilling training methods customized to your team’s level of maturity and business objectives.
    • Choose partners who can integrate various components into a coherent plan aimed at optimizing your brand’s overall marketing performance to your advantage.

That is who we are at in4mation insights.  Below are the services that we provide to clients, but most important are the business questions these services help you to answer.

If you’re tackling issues related to media spending or grappling with intricate pricing challenges, consider partnering with a firm that prioritizes understanding your goals. Reach out to us today at info@in4ins.com for a conversation.

Constrained Choices in Choice-based Conjoint Analysis

An essential concept in consumer decision-making is that choices are made under constraints. Chiefly among these are having enough time and enough money, which are particularly pressing in today’s post-pandemic, inflationary climate.

As additional examples, limitations like dietary restrictions on ingredients such as salt, sugar, or gluten also constrain purchasing decisions.

However, a notable oversight of traditional Choice Based Conjoint Analysis (CBCA) as typically applied is its failure to account for any constraints whatsoever.

In particular, CBCA does not incorporate the buyer’s money budget into its price sensitivity estimations and predictions.

A new feature of the in4mation insights’ (i4i) choice modeling toolkit is Budget-Constrained CBCA (BC-CBCA) which operates on two straightforward assumptions:

    • First, any product priced beyond an individual’s budget when presented in a conjoint survey, is disregarded, rendering its value null — no amount of brand prestige or appealing features can influence its selection. We do acknowledge that, in special situations, people will exceed their budget, yet not by that much, creating a new, slightly larger budget constraint.
    • Second, for items within their budget, consumers exhibit relative price insensitivity, reasoning that, “If it’s within my budget, I can afford it.” BC-CBCA , as we apply this innovation, starkly contrasts with traditional CBCA by directly incorporating budget constraints into the decision-making process.

Consequently, price sensitivity for items under the budget limit is less pronounced. This leads to substantial differences in predicted overall choices between BC-CBCA and standard CBCA.

Importantly, in i4i’s BC-CBCA approach, the budget threshold does not have to be asked in the survey. Rather, it is estimated probabilistically based on participants’ choices within the context of the CBCA task. We note that the budget limit can be asked in the survey, but in that case it is a first approximation of what BC-CBCA will eventually calculate and use in estimation of the magnitude of all choice drivers.

An Example

Several years ago, we conducted a study looking at the choice of digital cameras. Roughly 450 prospective buyers replied to eight choice situations. Each situation had four brands or none to choose from. About ten attributes were investigated, including seven brands and prices that ranged from a low of $199 to a high of $459.

We counted the number of people who BC-CBCA estimated to be budget constrained; that is, they would not purchase a camera that cost more than the maximum price of $459. We found that about one-third have a budget greater than the maximum price shown in the survey (we call them unconstrained) and about two-thirds are budget constrained, meaning their budget limit is less than $459.

If we look only at those people who are constrained, we can estimate their maximum willingness to pay, in other words, their budget limit. Looking at this chart, you can see the percentage of people whose budget limit is at each of the bars, $10 at a time. The red line shows the cumulative percentage of people below the maximum price displayed, all of whom are budget constrained, but at different limits.

For example, the second blue bar from the left crosses the Y-axis at 20% indicating that percent of people have a budget limit that is $270 or smaller. If you mentally group the bars, you might say that there are three-four segments of people with budgets at different limits.

As previously mentioned, the constrained budget model yields a different price sensitivity than the standard approach does. To demonstrate this, we first created a “base case” of cameras with their features and prices. We chose camera brand “N” as our test of the price sensitivity. Displayed in this chart is the predicted choice share on the vertical Y-axis. The horizontal X-axis goes from $0 to $1000, although $199 was the lowest price evaluated across all brands and $459 was the highest price tested price. At the lowest price of $199, the two approaches – budget constrained and standard MNL –both predict a choice share of just over 50%. However, at the highest price evaluated, the standard approach predicts a choice share of 30% and the budget model predicts a little over 10%. Which seems more realistic and believable to you?

The budget constrained model has a much steeper price-choice curve. Why is that? As the price increases, the budget limit of individual people is being reached.

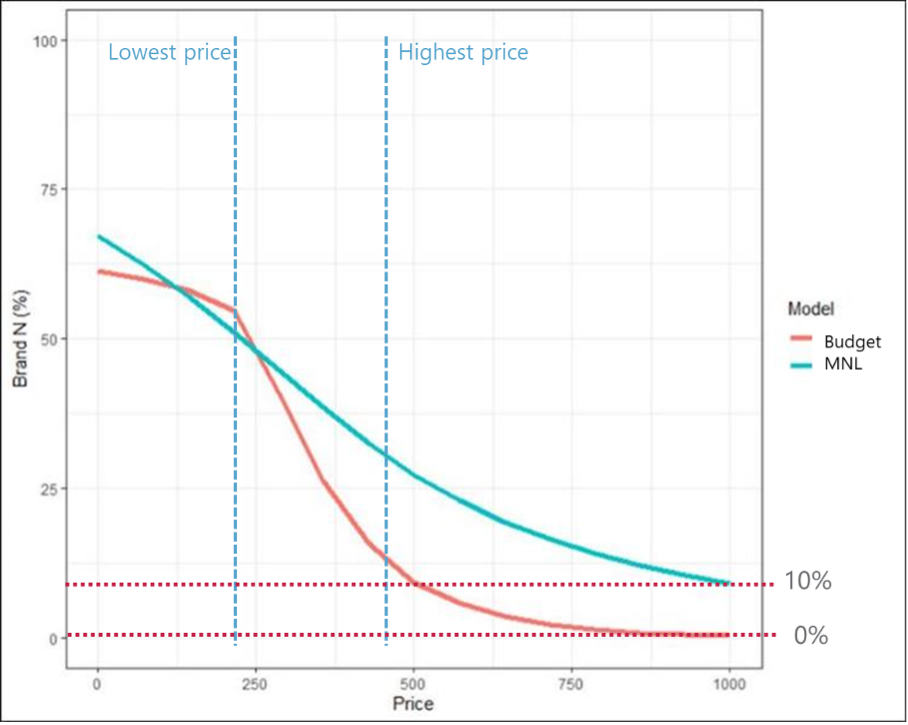
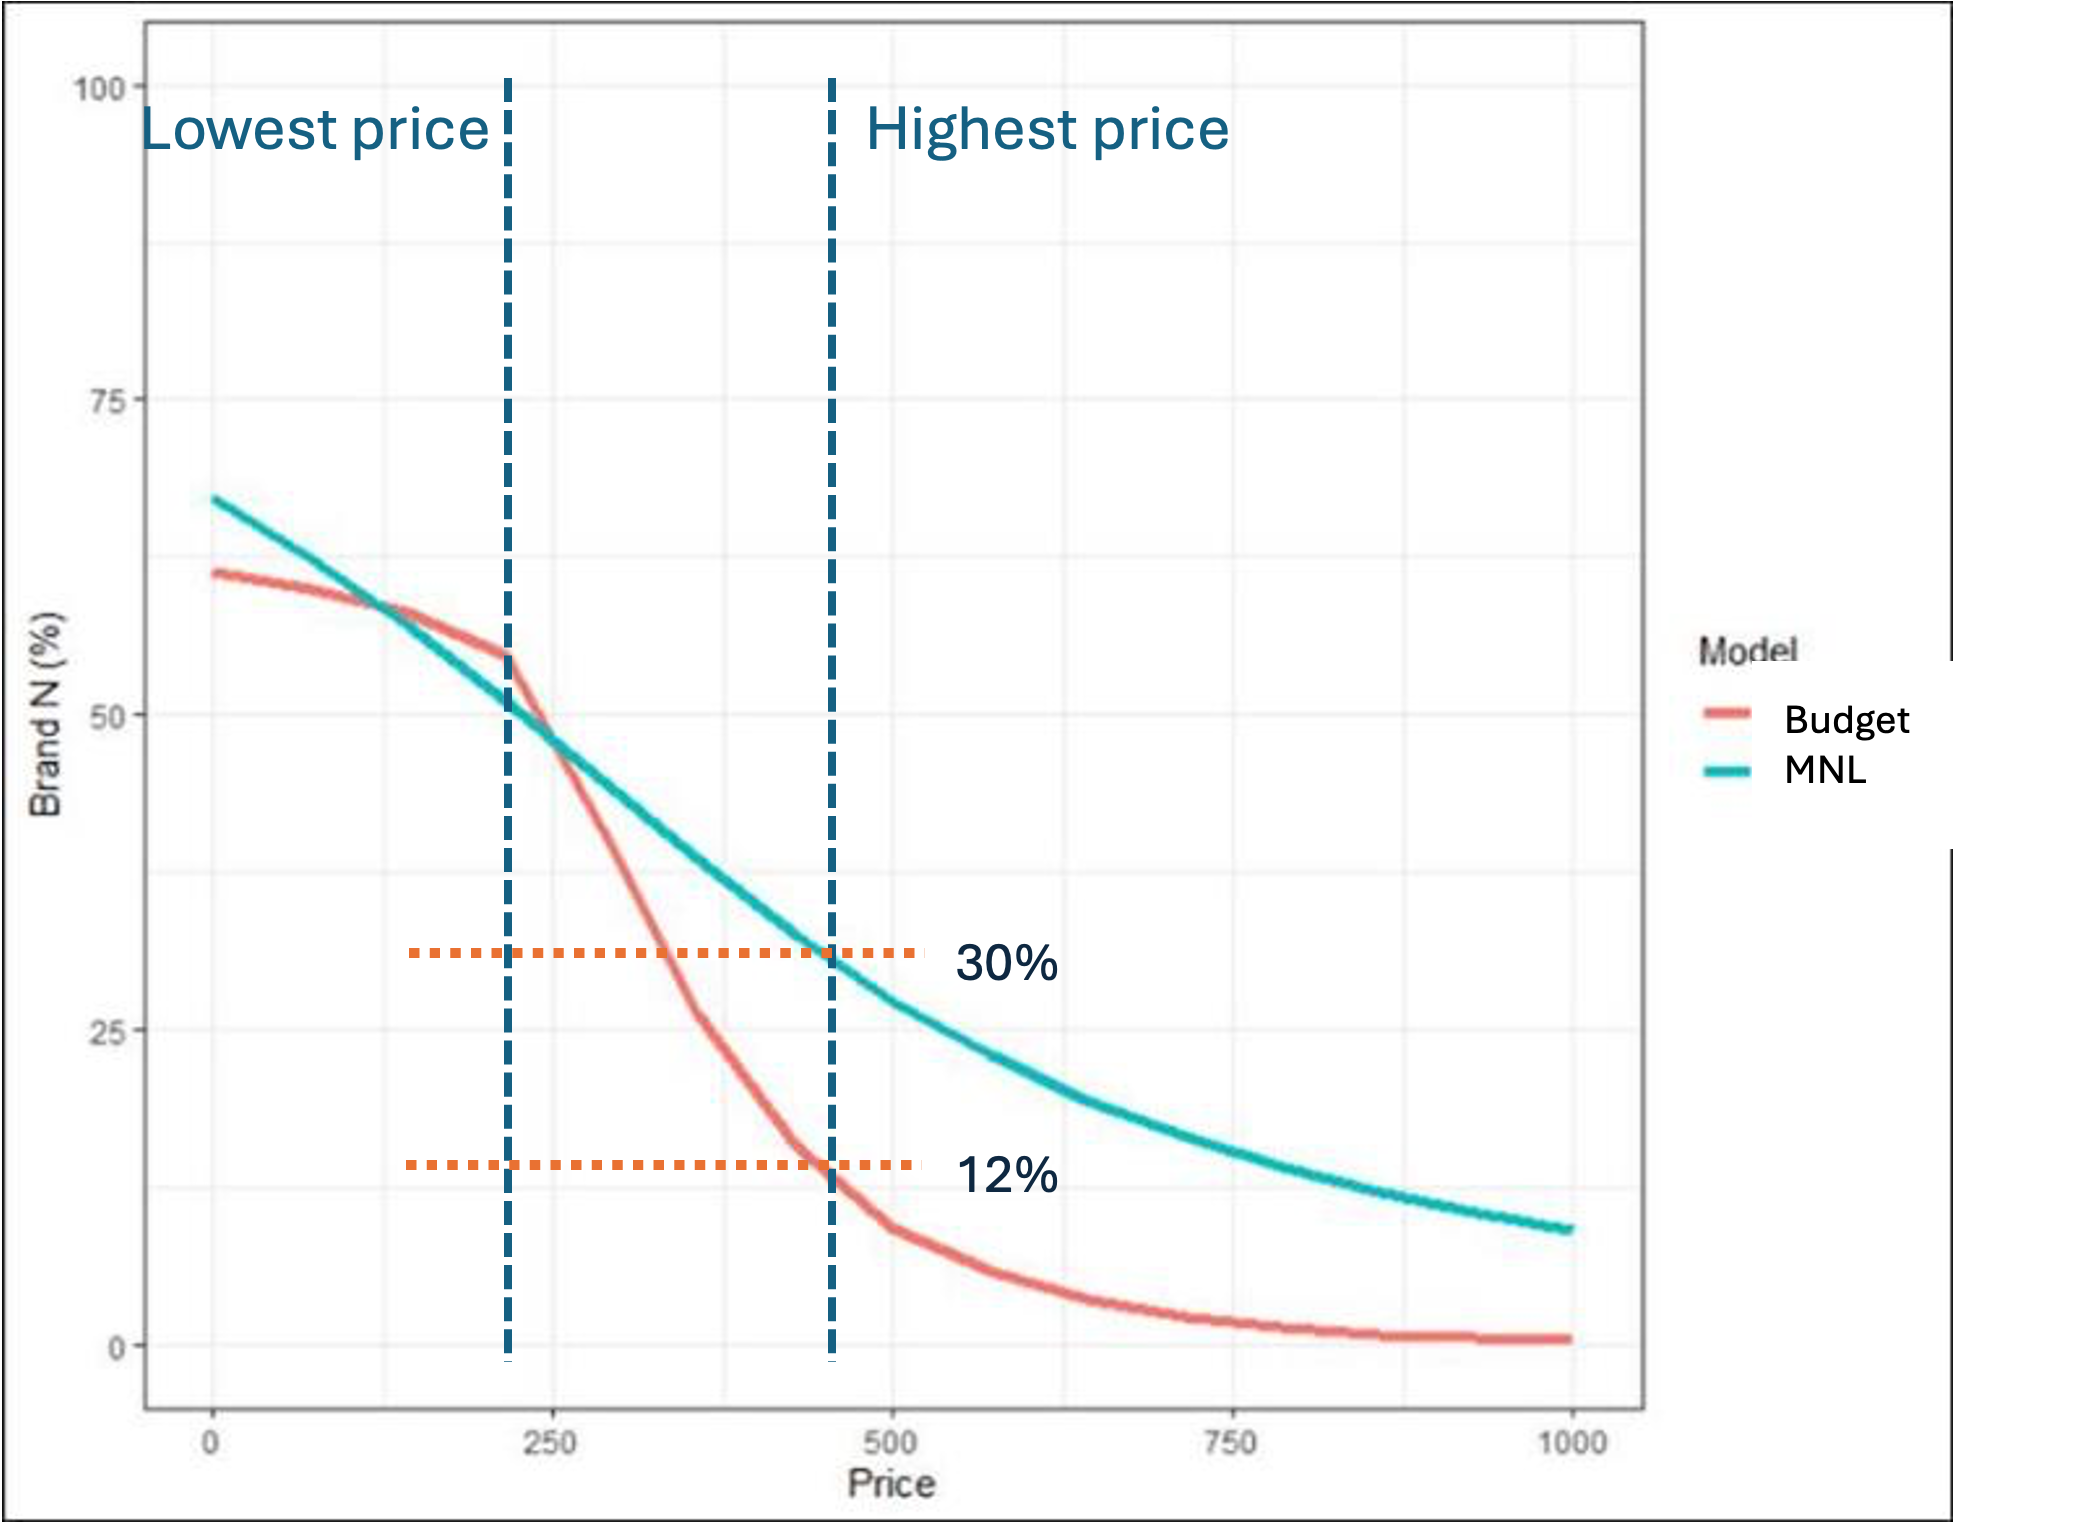
When the price exceeds their budget; the product becomes unaffordable and they “drop out” of buying that camera.

To show that the budget model will deliver more realistic results, we increased the price of camera N to $1000, as shown below. In this case, you will note that the standard MNL analytic model predicts that 10% of buyers will still chose Brand N – even at a price that is more than twice the maximum tested!

On the other hand, the budget constrained model delivers a more realistic result: no one will purchase at $1000, and in fact, the budget approach reaches 0% choosing “N” at around $800.

What is happening in the budget model versus standard multinominal logit (MNL) models? The standard only has one way to measure the effect of price (price sensitivity) while the budget constrained model has two ways (price sensitivity and a budget constraint). Since the standard model is “missing” the budget information, it increases the price sensitivity to make up for the fact that the budget limit is unknown.

Summary

Employing constraints in advanced CBCA offers more realistic predictions of buyer behavior across various categories, including hotel and travel selections, durable goods, electronics, premium products, and even groceries purchased at supermarkets. BC-CBCA distinguishes between individuals with financial constraints and those without, identifying segments of individuals with similar budgetary limitations.

This enables tailored product designs and offerings for different buyer groups with different constraints. Additionally, in BC-CBCA, we have observed that once the budget is accounted for, the role of price diminishes, and brand and product features play larger roles in influencing purchases.

Next Steps

BC-CBCA works. It produces deeper insights than the traditional approach.

We can show you.

We will even run BC-CBCA with your data from a standard CBCA project that you completed in the past.

That’s how sure we are of the power of BC-CBCA.

If you wish to fine tune your understanding of how consumers make choices regarding your products and services, by leveraging Budget Constrained – Choice Based Conjoint Analysis, contact us to discuss your challenges at info@in4ins.com.

Four Next Generation CBCA Tools to Understand How People Make Choices

Marketing aims to influence the decision-making moment when a buyer selects your brand or item. This choice translates to adoption, increased revenue, loyalty, and growth. For decades, researchers have been looking for an unquestionable source of data-supported insights to determine what influences consumers’ choices and guides decisions. With this information, companies can set priorities for customer experience, product development, optimal pricing, and messaging, ensuring that choice equals sales and ultimately enabling businesses to measure ROI of marketing initiatives before engaging in them.

Since its inception, Choice-based Conjoint Analysis (CBCA) has proven invaluable for brands aiming to grasp consumer behavior. Initial developments in CBCA evolved into useful survey techniques focused on unraveling decision hierarchies and understanding how tradeoffs influence decision-making. Undoubtedly, the methods developed years ago were revolutionary for their time, but even the best marketing research methods have their shortcomings. What was previously thought of as the “gold standard for choice modeling,” has reached its limits without further refinements based on in-depth understanding of human behavior.

As a pioneer in the introduction, development, and commercialization of CBCA and related tools like MaxDiff and Menu-based CBCA, I can tell you that it is finally time for our industry to step up, to stop using outdated and simplistic models and methods, and to embrace superior solutions.

Advancements in the science of decision-making have spurred innovations that challenge conventional wisdom by incorporating more robust behavioral assumptions. These developments, primarily driven by academic research, remain largely unknown to most practicing researchers.

As longstanding pioneers in applying choice methodologies to marketing issues, in4mation insights (i4i) continues to leverage state-of-the-art techniques to tackle our clients’ evolving business challenges. Stemming from our extensive investigations in marketing science and behavioral economics, these innovations enhance our ability to forecast choice behavior and to drive superior business outcomes.

These new advancements in choice modeling, as elaborated below, greatly improve our comprehension of the factors influencing consumer choice. The insights derived from these innovations empower companies to better uncover optimal product attributes and pricing models that resonate with consumers, all while understanding the intricacies of decision-making within the confines of their everyday lives and budgets.

These are not minor adjustments – we are highlighting these advancements to fundamentally overhaul CBCA’s alignment with data, altering the direction and intensity of choice effects, yielding more precise predictions of consumer behavior and business results.

Our new advances in CBCA tools are:

1. Constrained Choices

An essential concept in decision making is that all choices are made under constraints. Primarily among these are having enough time and enough money, which are particularly pressing in today’s post-pandemic, inflationary climate.

An individual buyer’s budget offers a threshold beyond which they will not purchase an item, no matter its attractiveness. With so many news articles describing how consumers and businesses are tightening their belts and watching what they buy, understanding the role of a budget in choice is even more critical than it has been in the past.

However, while CBCA does not incorporate the buyer’s budget into its price sensitivity estimations and choice predictions, a new Budget-Constrained CBCA (BC-CBCA) does just that.

By employing budget constraints in CBCA, our i4i approach offers more realistic predictions of buyer behavior across product categories, from expensive durables to groceries purchased at supermarkets. BC-CBCA identifies segments with similar budgetary limits, thus enabling product designs and offerings tailored to different groups. Importantly, the underlying math of BC-CBCA guarantees a fit to the data that is as good as or even better than standard CBCA.

2. Do people pay attention to everything?

A foundational assumption of standard CBCA is that everyone processes all the information available to them and they make compensatory trade-offs. But what if they do not, and instead, they use simplifying rules to pay attention to just a subset of the information? Attribute Non-Attendance (ANA) uncovers who does and who does not pay attention to all the information. The result is that ANA enhances traditional CBCA by offering more accurate predictions, since it enables us to uncover the impact of the true salient attributes affecting choice. Our recent work has revealed that sometimes as little as 10% of consumers consider all attributes in their decision-making, strongly challenging the bedrock assumption of standard CBCA.

3. Asymmetric and Symmetric Choices

The standard statistical tool of CBCA is Multinomial Logit (MNL) which governs the math behind choice modeling. A less well-known aspect of MNL is its symmetric prediction of choice behavior. At a 50% likelihood of purchase, equal increases or decreases in product attractiveness (utility) will produce equal gains and losses in choice shares. The symmetric property can lead to unrealistic predictions, especially when the final predicted choice shares among alternatives varies widely — a scenario all too common in virtually all choice studies.

A new enhancement to standard MNL abandons the symmetry assumption in favor of asymmetry. At i4i, we have found that employing asymmetry in choice fits choice data better than symmetric MNL, more accurately reflecting real-world decision-making patterns, and yields vastly different choice share predictions.

4. Regret minimization (RM) versus Utility maximization (UM)

While conventional CBCA approaches assume that buyers aim to maximize the utility of their purchases, some opt for products that help them avoid losses. In contrast to Utility Maximization, Regret Minimization closely aligns with the behavioral economics principle that “losses loom larger than gains.” If we acknowledge that not all people are utility maximizers, it’s crucial to have choice models that can accommodate different decision-making strategies. Our experience at i4i has proven that a hybrid method, recognizing that some individuals prioritize maximizing utility while others focus on minimizing losses, produces superior results, rather than a monolithic approach where all individuals exclusively use UM to the detriment of RM or vice versa.

=  =  = =  =  =  =  =

We will be expanding on the details behind these four new developments in choice modeling in the coming weeks.

We are excited about the potential that these new cutting-edge enhancements to CBCA tools offer marketers, especially during these challenging times.

Whether these innovations address the gaps you have encountered with traditional CBCA or if you’re simply intrigued by their potential application in your business, please reach out to us at info@in4ins.com.

Let’s explore how we can enhance your choice architecture to drive sales growth.

Why is Retail Media ROAS so Hard to Measure?

There are a lot of signs that trade and retail media networks (RMNs) are converging. This is driven on the one hand because retail media and trade are increasingly financed from the same source: sales co-op funds. On the other hand, they are both converging on the lower funnel – the first moment of truth. Why would tactics so close to the point of purchase be so hard to measure?

To make sense of this and to understand why retail media ROAS is so hard to measure, we have to look at the simple formula: ROAS = Contribution/Media Cost. When evaluating the profitability of retail media, there are problems with both the numerator and the denominator. The cost (denominator) is often higher for the same service (programmatic or social)  if you buy it through the retailer versus buying directly. As a client-side friend put it:

“CPMs for RMNs are (basically) made up. They’ll charge you $18.00 CPMs for a Facebook buy that is completely disconnected to the actual CPMs in the auction. They just pocket all the overage and margin.”

On the other side of the table, an industry consultant reported a Walmart executive saying:

“I’m glad that Walmart connect generates such high margin income for us to offset losses in other parts of the business.”

What is happening in practice is that the RMN costs are being bundled together with other fees as a cost of doing business with the retailer. So, in truth, there are other goodies hidden in the RMN cost such as slotting fees, preferred display locations, etc.

The other problematic part of the ROAS equation is in the numerator – the contribution or lift from media. With most performance media, the drivers of contribution are audience reach and frequency, sometimes at DMA level. With RMNs the media is driving offline sales within the retailer’s marketing area. It is also focused on specific UPCs. This specificity is a two-edged sword: it makes the impact easier to derive because it is so specific, but it also reduces its scope. In fact, only the biggest retailers (e.g., Amazon, Walmart, Kroger, Target, Best Buy, Instacart) have the scale to drive enough traffic to read.

The current practice for deriving the effect of retail media is to treat it just like any other performance media variable in a marketing mix model without paying attention to details of tactic, geography, or the mix of online/offline sales channels.

With all that in mind, here are of the top considerations to improve the quality of the estimate of lift (the numerator of ROAS):

  1. If the retailer is one of the top RMNs (excluding Amazon), then it makes sense to derive the retail media impact on sales within the trade RMAs. This requires access to chain or RMA-level data.
  2. If the RMN advertising is for specific UPCs or sub-brands, it makes sense to estimate the sales impact at least at the sub-brand level. Because RMN data moves through media systems, it is not easy to obtain UPC-specific data. Text processing is usually required to infer the sub-brand from various identifying strings.
  3. Since all these sales impacts are proportional to size of retailer marketing areas and of the sub-brand, a multiplicative marketing mix model will provide much better results than an additive model, since its effects are automatically scaled. This is similar to the way that multiplicative models are more accurate for trade promotions.
  4. The impact of adstock/saturation must differ by tactic. Onsite search is lower funnel and short-acting whereas offsite media can be much longer-acting.
  5. There are many types of impacts on sales to consider, including both direct and halo. This table shows the relationship between the type of media (onsite vs offsite) and the sales impact as we move from the most direct (onsite search driving online sales) to the most attenuated (offsite media driving sales in the same high-intent lookalike target anywhere).
Media Type Direct Halo Secondary Halo
Onsite Online (DTC) Offline sales of same retailer Offline and online sales of other retailers (informational search)
Offsite/in-App Offline and online sales of all retailers

Using advanced modeling systems such as Robust Hierarchical Bayes that take geography and UPC into account, we can accurately track the effectiveness of RMNs (the lift per impression). DTC (onsite search/display driving online sales) has the most direct attribution path. Offsite targeting is usually less effective although there are exceptions. The ROAS depends on transparency in media costs – which at the present time is caught up in the vendor-buyer negotiation and escapes rationalization.

If you would like to discuss how our approach to Robust Hierarchical Bayes can help you better measure your Retail Media investment (and your marketing mix performance as a whole), schedule a call with the i4i Team.